| Time | Topic |
|---|---|
| 13:00 — 13:20 | Grouping and summarising data Recoding with case_when |
| 13:20 — 14:50 | Practical 1 |
| 13:50 — 14:40 | Visualisation with ggplot2 |
| 14:40 — 14:50 | Break |
| 14:50 — 16:30 | Practical 2: Mini-project |
| 16:30 — 16:55 | Going through your projects |
| 16:55 — 17:00 | Wrap up and looking ahead |
Session 3 (“Intermediate”)
In this session, we will:
Finish going through the ‘essential data manipulation techniques’ from Session 2, including grouping (
group_by) and summarising (summarise) data frames, and usingif_elseandcase_whento recode.Introduction the popular
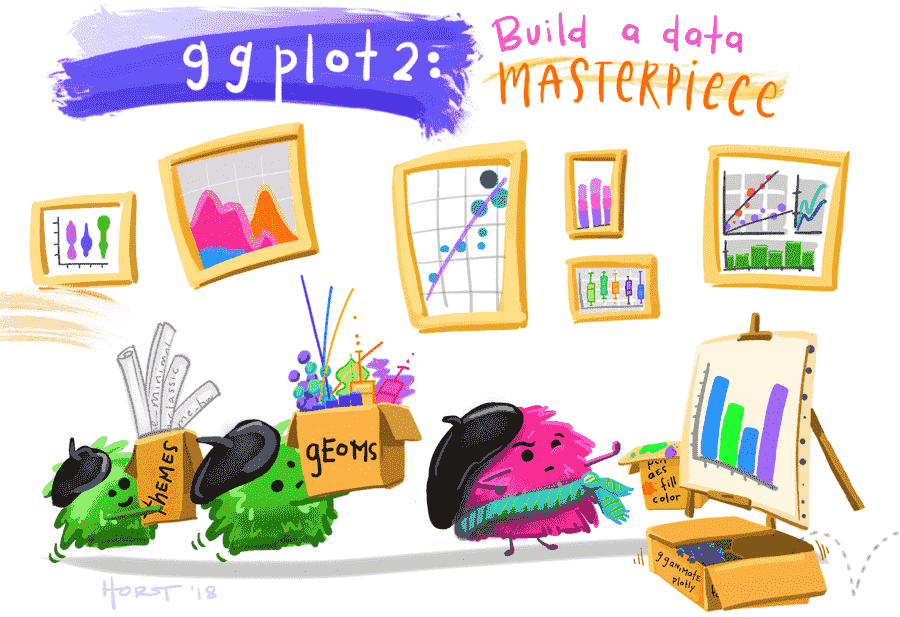
ggplot2package for plotting and visualisation.Work through a mini project, applying the skills learnt so far to a real-world dataset.